
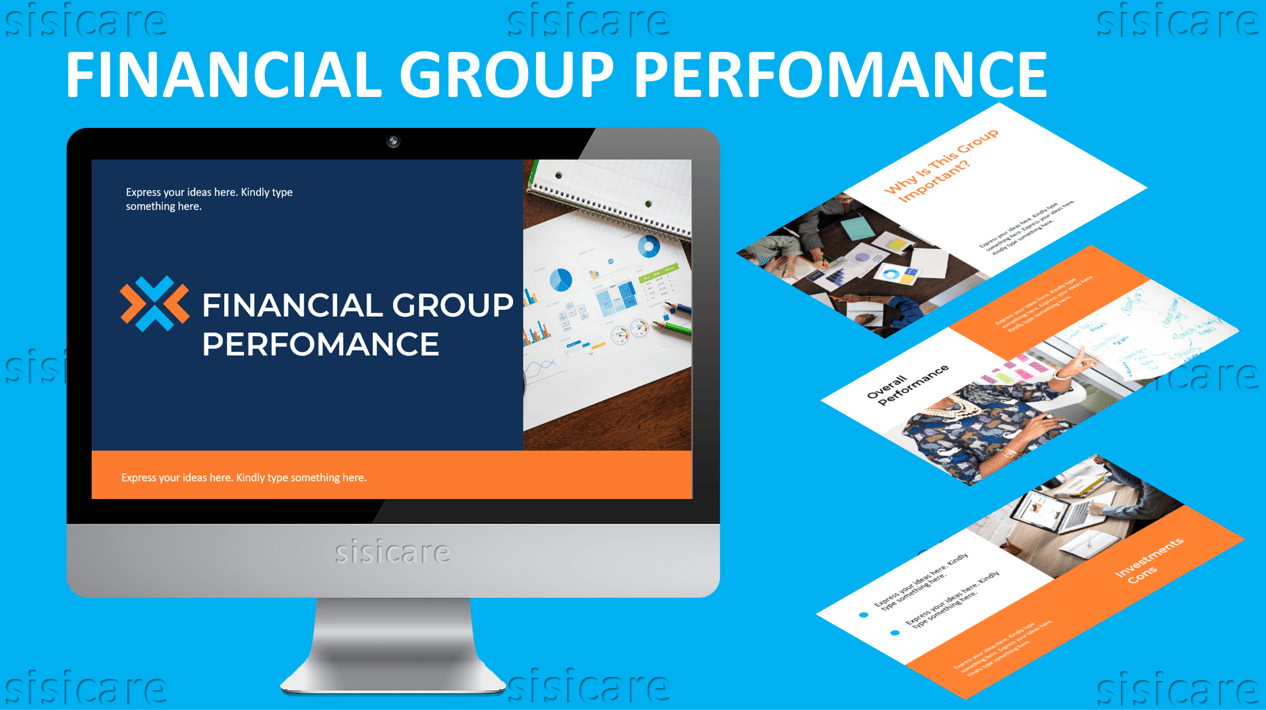
Financial Group Performance
Original price was: $27.00.$2.70Current price is: $2.70.
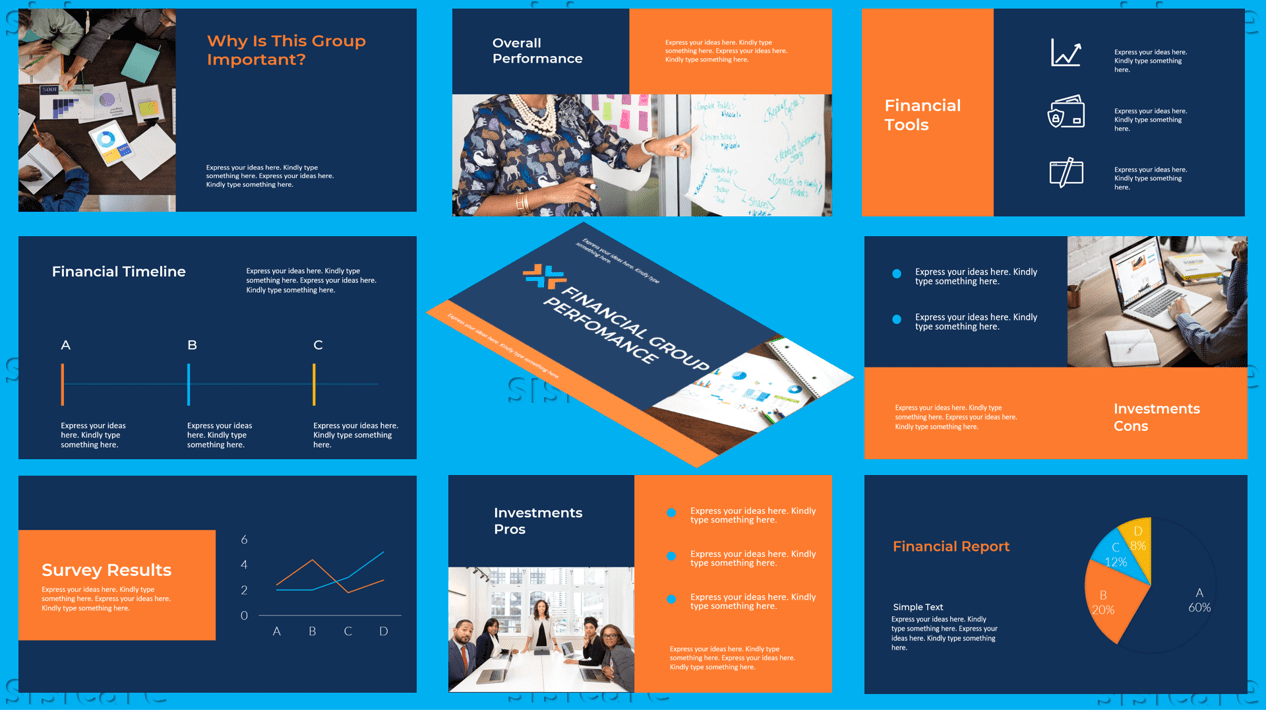
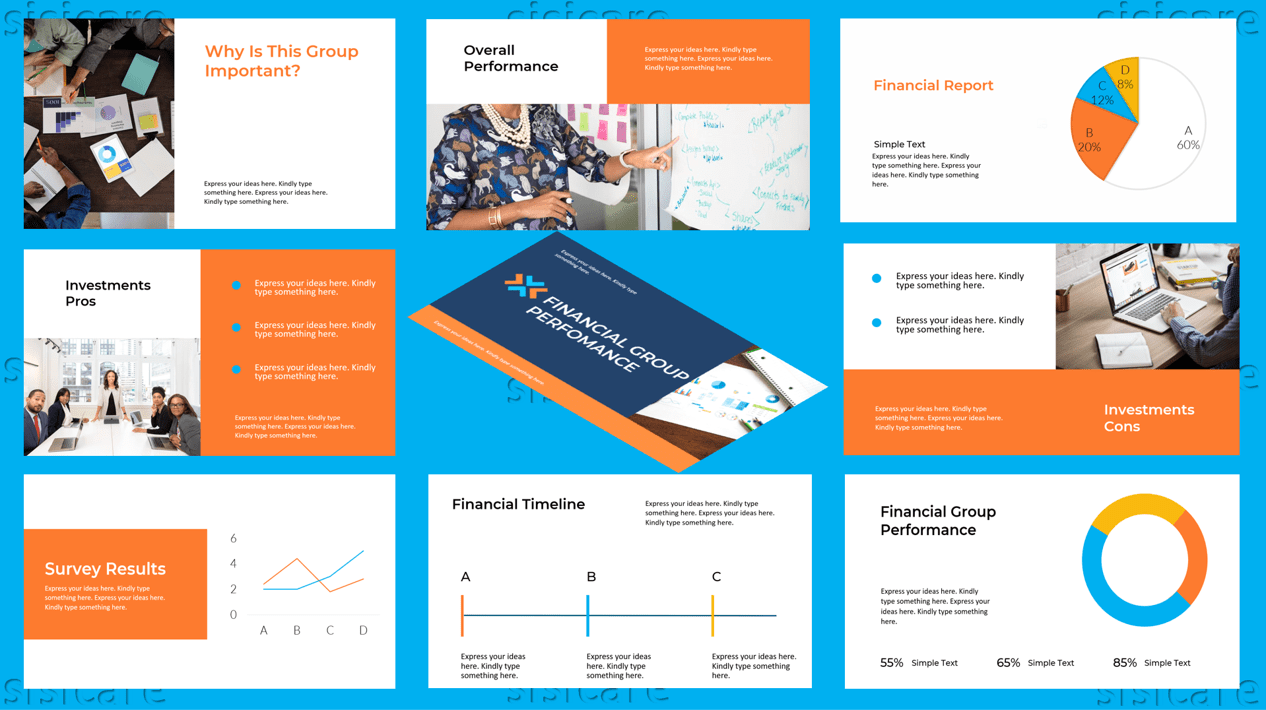
The Financial Group Performance Presentation allows you to present your financial results in a variety of ways. You can present the data using a line graph, column graph, pie chart, bar graph, and table. You can also include information about the trends in your company’s performance.
Description
Highlight your gains and lay out the strategy for a better financial future
The Financial Group Performance Presentation helps your team present a clear picture of the business’s financial performance by highlighting its key figures and strategies. It is designed to help you share the information you need with your colleagues. With an easy-to-read chart, you can quickly compare the performance of your company to that of other businesses.
- Fully editable in PowerPoint (shapes, icons, mockup, etc.)
- 4:3 and 16:9 screen layouts (FULL HD!)
- Slide transition animation
- 20 unique slides for both themes (+master slides)
- Up to 2 pre-made themes (light & dark)
- Devices mockup
- Image placeholder
What`s inside the package
- Colored-Light theme template with 4:3 and 16:9 screen layouts
- Colored-Dark theme template with 4:3 and 16:9 screen layouts
Related products
-
- Sale!
- Business, Dark Theme, Light Theme, Presentations
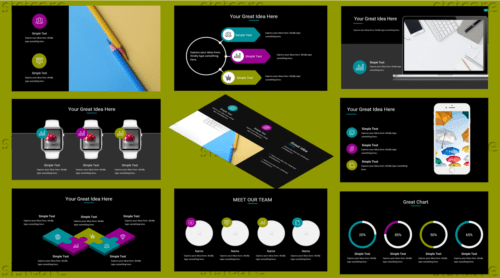
Company Teal Theme
- Original price was: $27.00.$2.70Current price is: $2.70.
- Add to cart
-
- Sale!
- Business, Dark Theme, Light Theme, Presentations
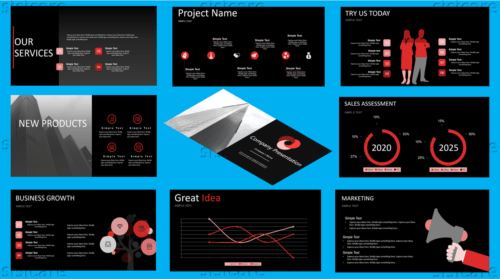
Red and Black Theme Presentation
- Original price was: $27.00.$2.70Current price is: $2.70.
- Add to cart
-
- Sale!
- Business, Dark Theme, Light Theme, Presentations
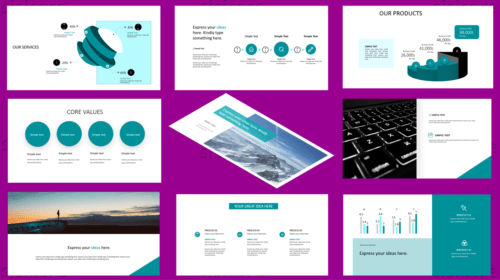
Teal and Purple Theme Presentation
- Original price was: $27.00.$2.70Current price is: $2.70.
- Add to cart


Reviews
There are no reviews yet.