Sale!
Business Chart Infographic
Ksh3,614.98 Ksh1,398.63
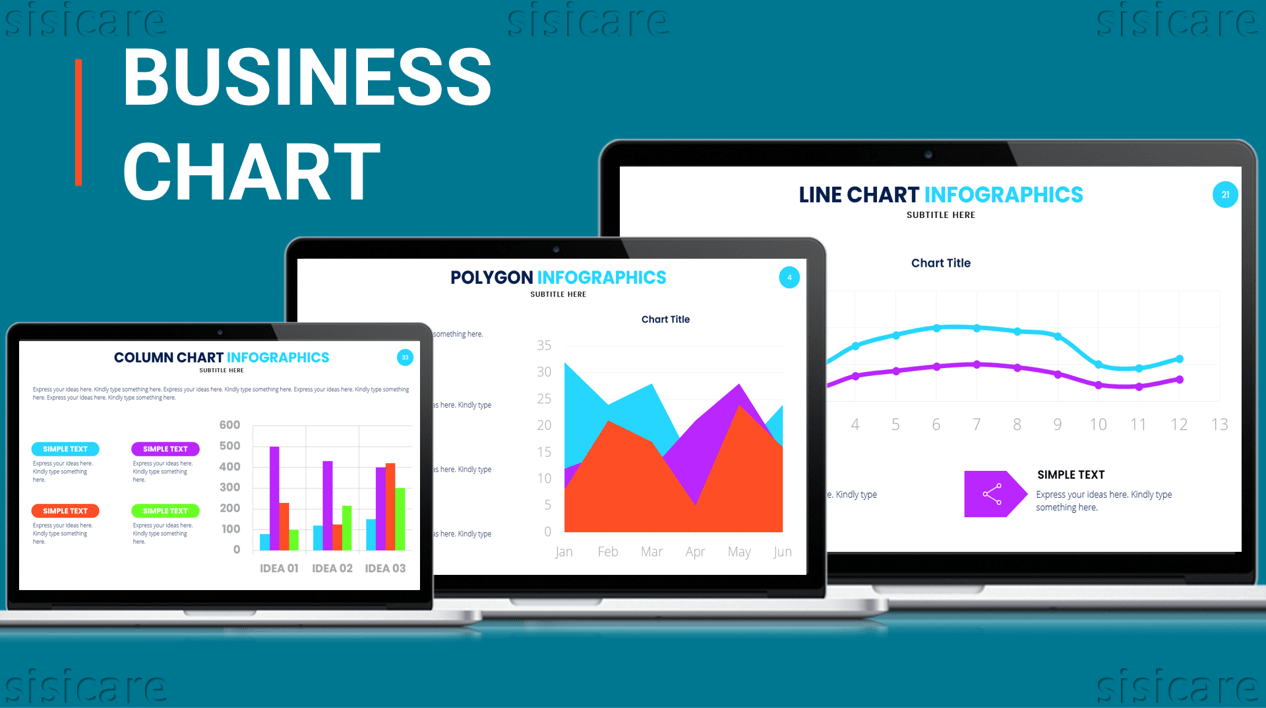
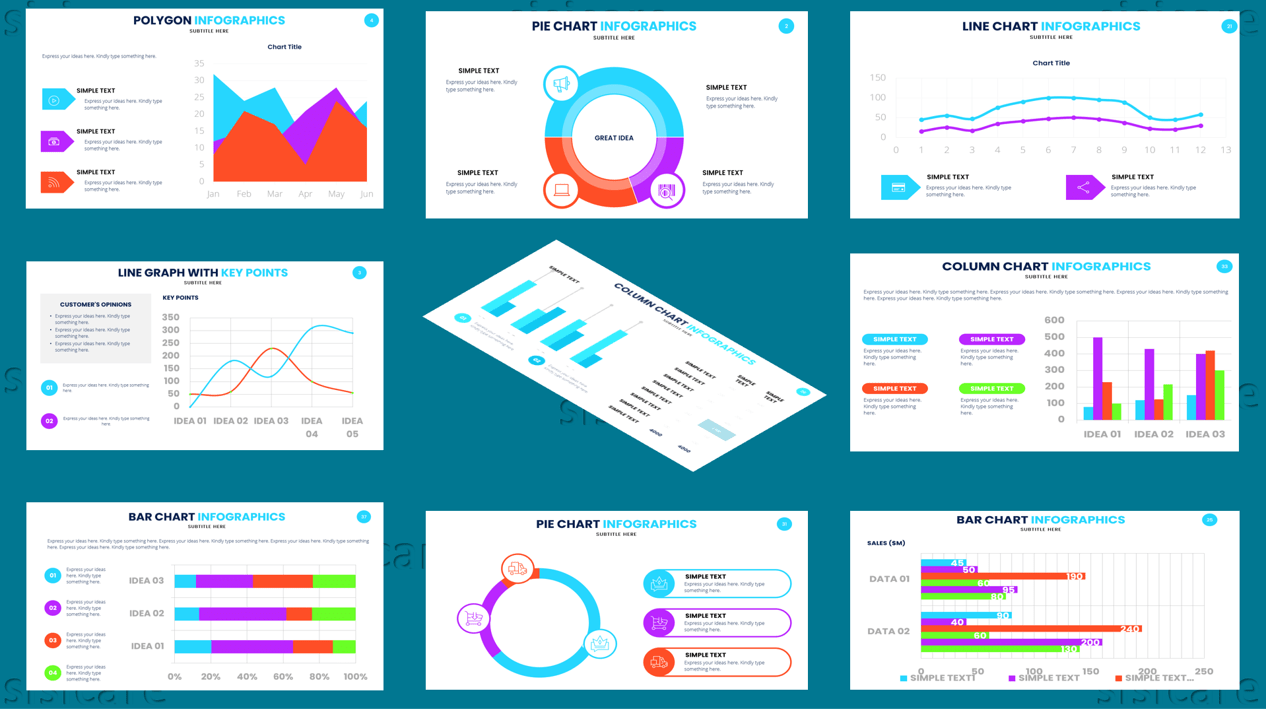
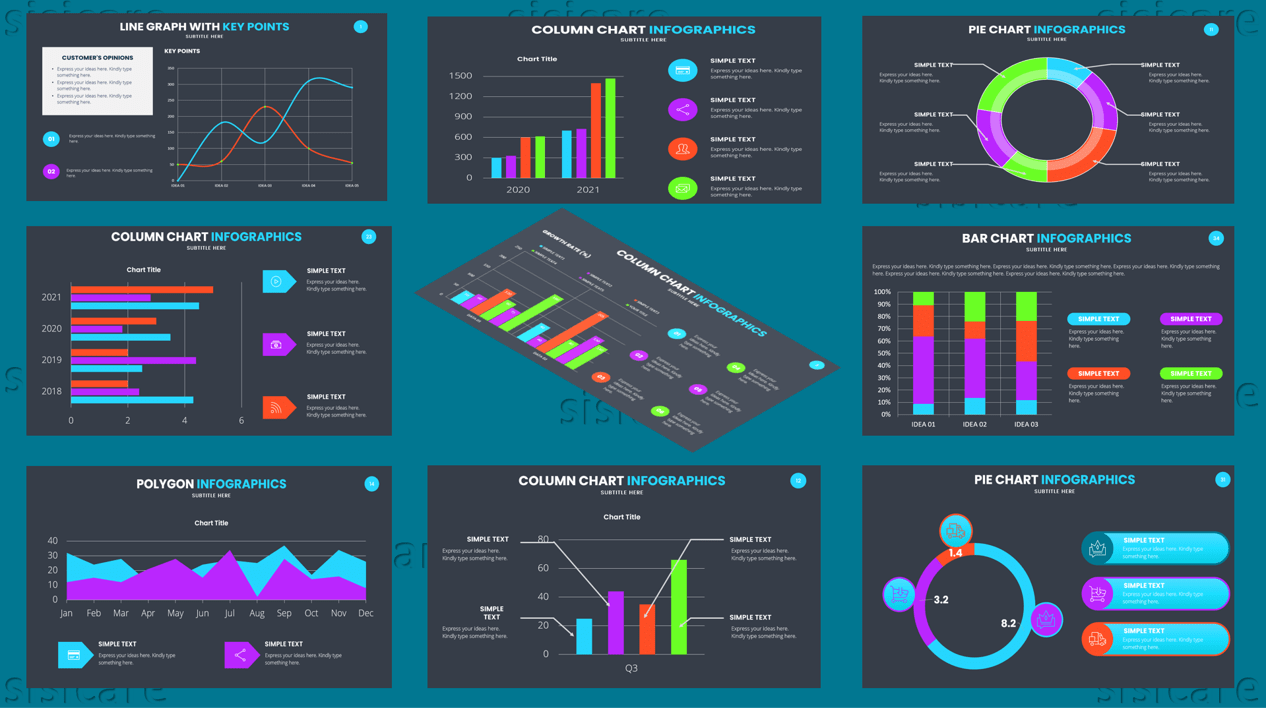
Business chart infographic lets you quickly view your data and make decisions with confidence. You can create stunning charts by using the powerful charting tools that come with Business Chart Infographic.
Categories: Charts Linked with Ms Excel, Dark Theme, Light Theme, Presentations
Tags: Black, Business, Charts, Education, Excel, Finance, Infographics, Linked, Marketing, Mockup, PowerPoint, Presentations, Professional, Sales, Slides, Template, White
Description
The best way to crunch the numbers and summarize the results graphically
Business Chart Infographic is a unique tool for visualizing statistics and data, created by a team of experienced business people to help you analyze your business or personal data. Using this tool will help you get the most out of the information you gather.
- Ms Excel linked charts
- Fully editable in PowerPoint (shapes, icons, mockup, etc.)
- 4:3 and 16:9 screen layouts (FULL HD!)
- Slide transition animation
- 36 unique slides for both themes (+master slides)
- Up to 2 pre-made themes (light & dark)
- Devices mockup
- Image placeholder
What`s inside the package
- Colored-Light theme template with 4:3 and 16:9 screen layouts
- Colored-Dark theme template with 4:3 and 16:9 screen layouts
Be the first to review “Business Chart Infographic” Cancel reply
Related products
-
- Sale!
- Business, Dark Theme, Light Theme, Presentations
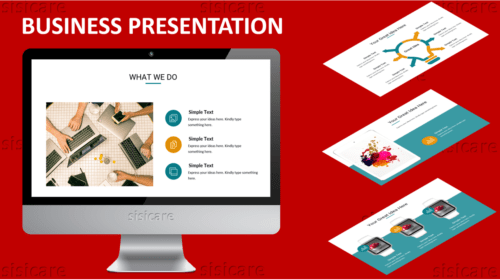
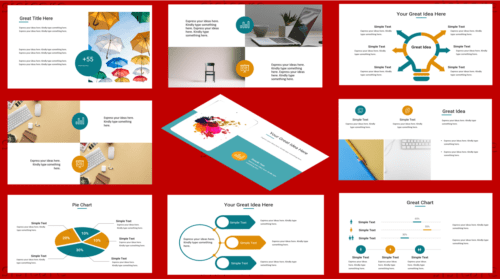
Gold and Teal Theme Presentation
-
Ksh3,563.66Ksh1,347.31 - Add to cart
-
- Sale!
- Dark Theme, Infographics, Light Theme, Presentations
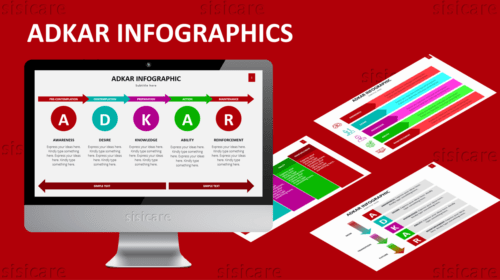
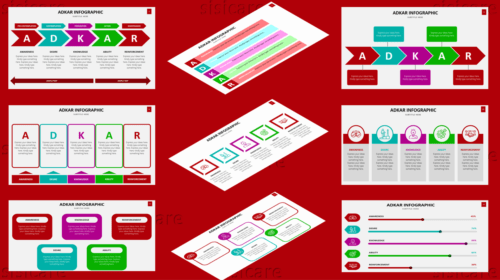
ADKAR Infographic
-
Ksh3,614.98Ksh1,398.63 - Add to cart
-
- Sale!
- Business, Dark Theme, Light Theme, Presentations
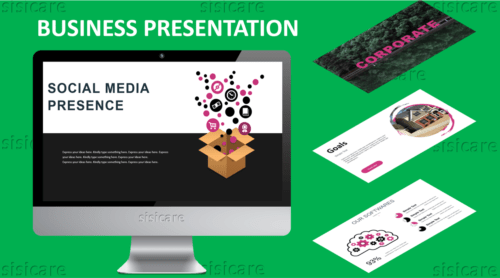
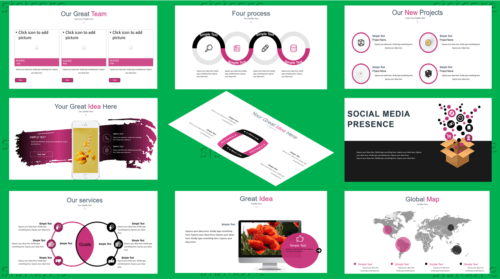
Pink and Black Theme Presentation
-
Ksh3,563.66Ksh1,347.31 - Add to cart

Reviews
There are no reviews yet.