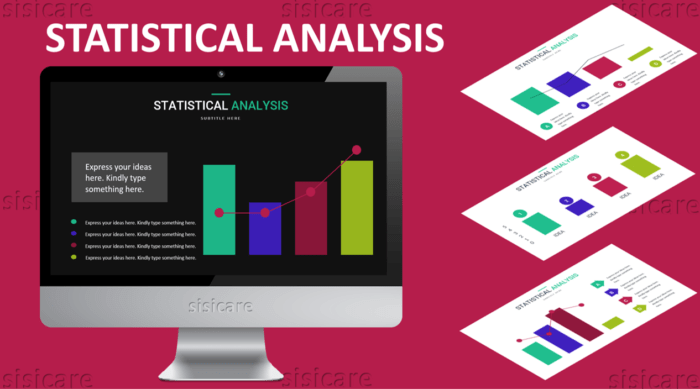
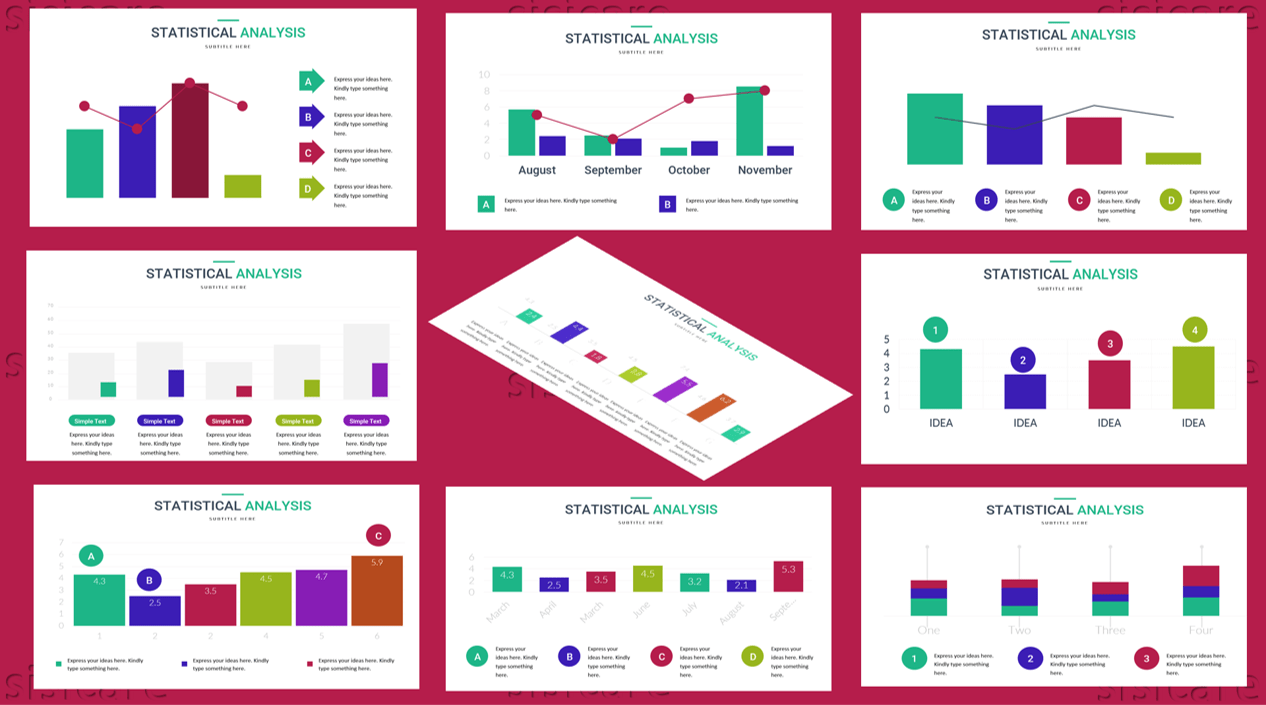
The best way to explain your analysis is with visual aids.
Statistical Analysis uses powerful visual analytics to create the most effective presentations that engage your audience. Your data will be displayed in the most engaging way possible with the use of visual aids. You’ll have the power to put your data into context and make more informed decisions. The visualizations can also be shared or embedded within other documents and presentations, making the results available anytime, anywhere.
Features
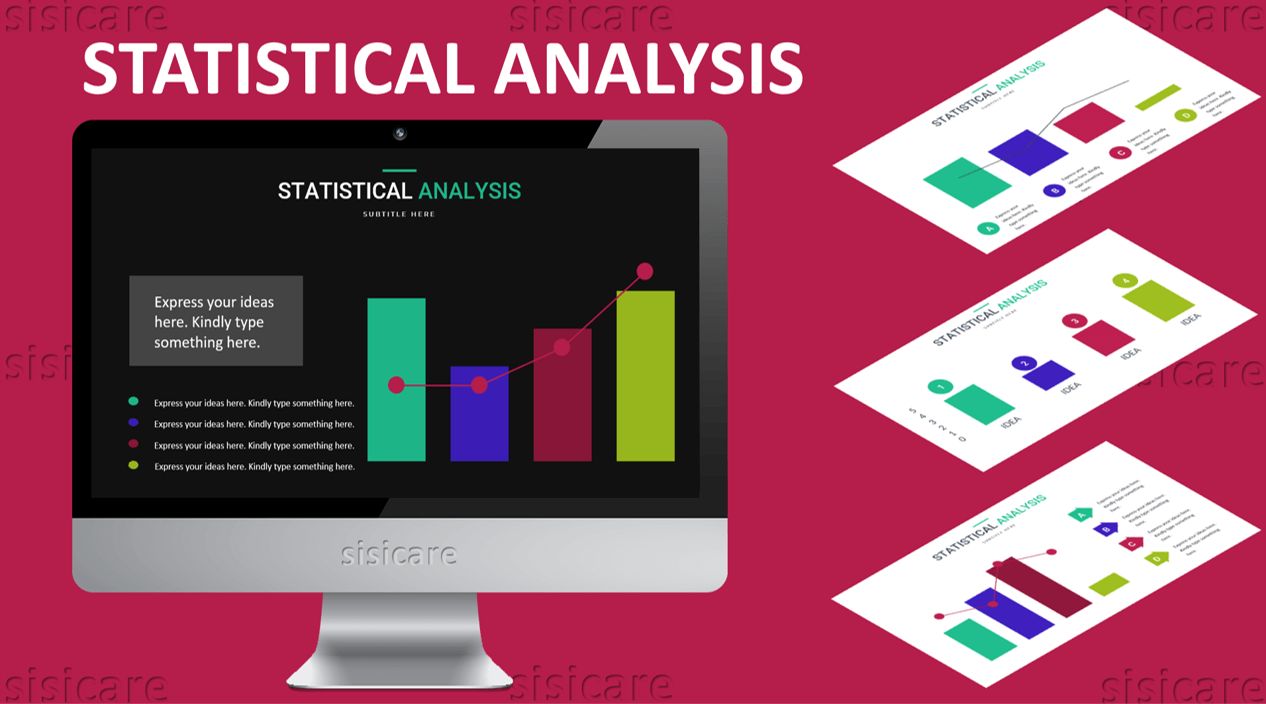
Fully editable in PowerPoint (shapes, icons, mockup, etc.)
4:3 and 16:9 screen layouts (FULL HD!)
Slide transition animation
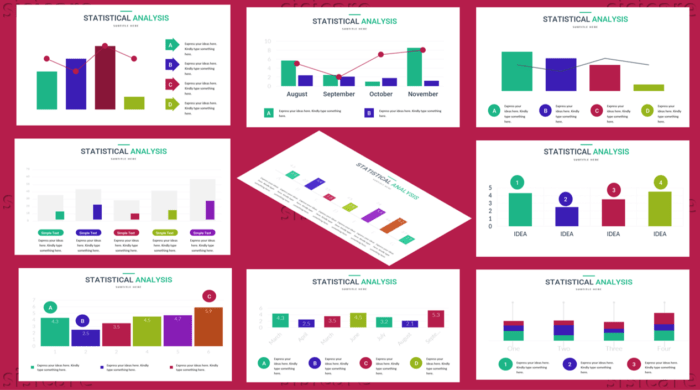
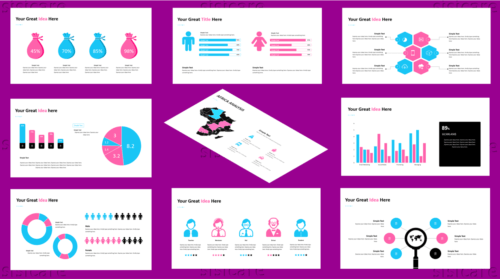
28 unique slides for each theme (+master slides)
Up to 2 pre-made themes (light & dark)
Devices mockup
Image placeholder
What`s inside the package
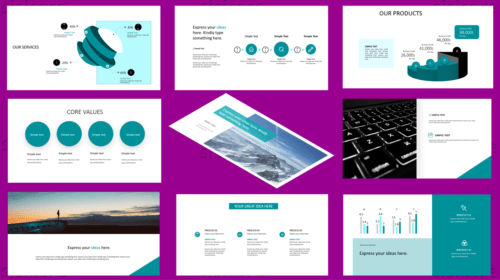
Colored-Light theme template with 4:3 and 16:9 screen layouts
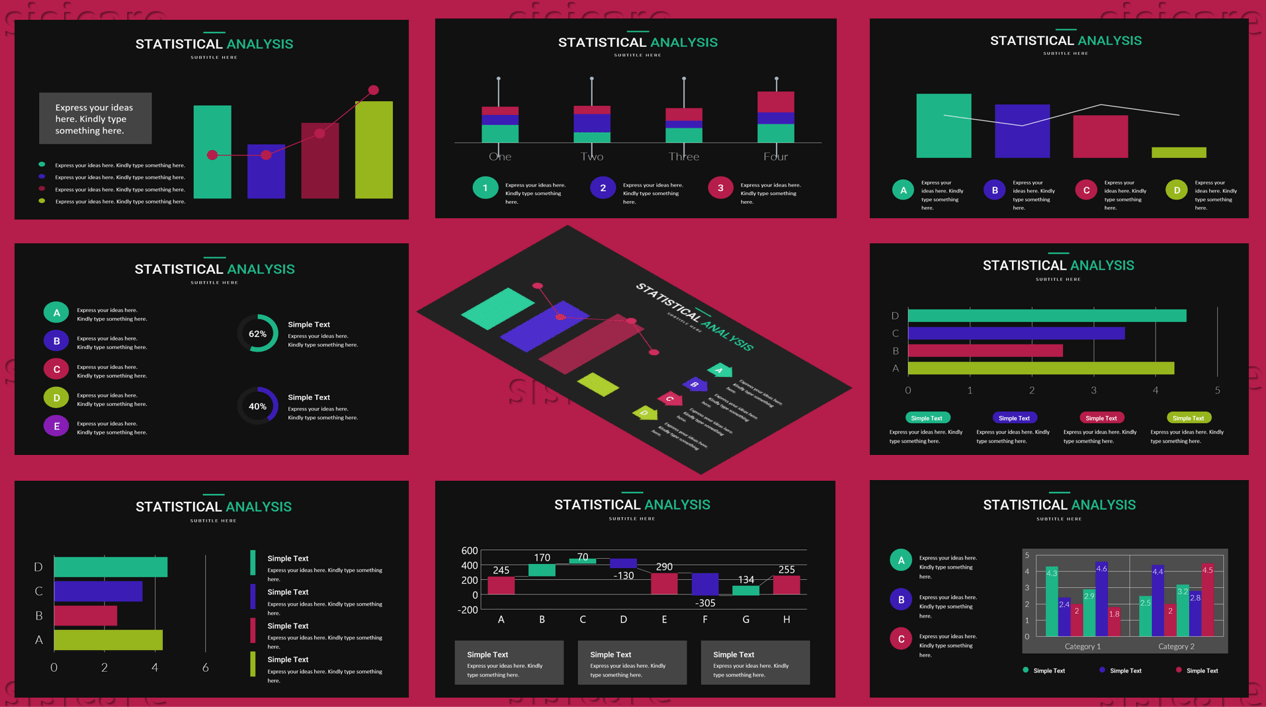
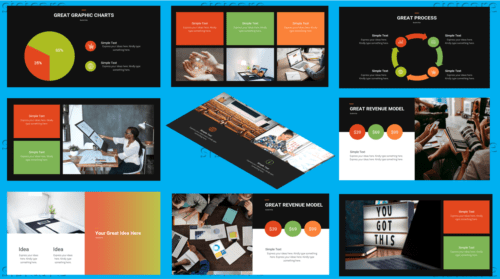
Colored-Dark theme template with 4:3 and 16:9 screen layouts
Reviews
There are no reviews yet.
Be the first to review “Statistical Analysis” Cancel reply


Reviews
There are no reviews yet.