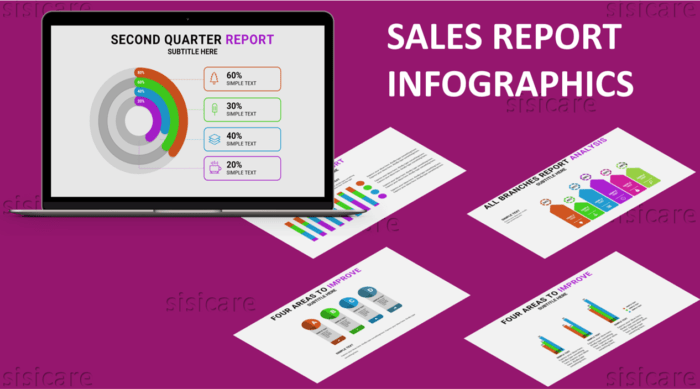
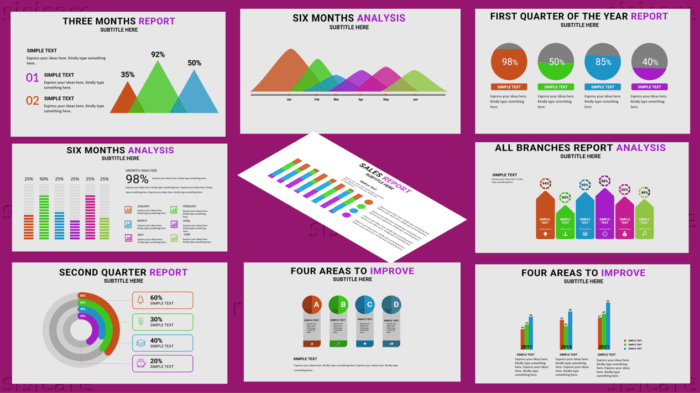
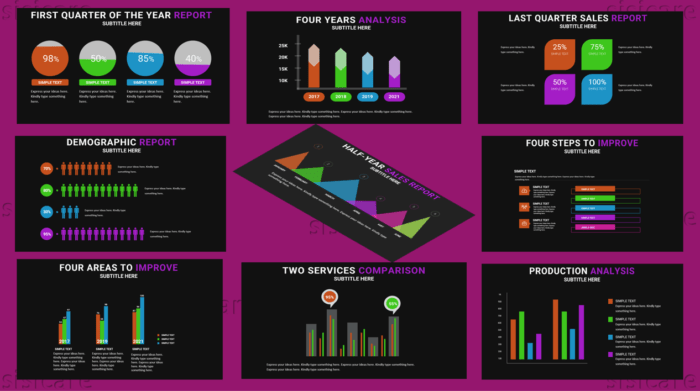
Sales Report Infographics is a visual representation of sales data with simple infographics that show you how your business is doing. Visualize the numbers that matter to you and compare your sales, income, and inventory. Sales Report Infographics allows you to analyze your data to make informed decisions and increase your revenues.
Features
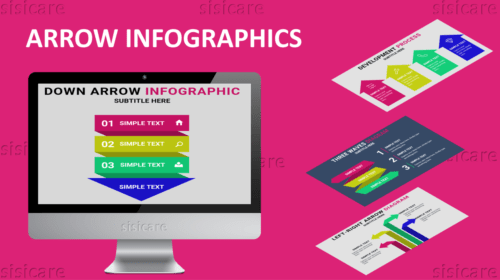
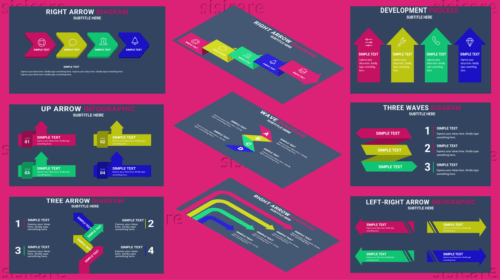
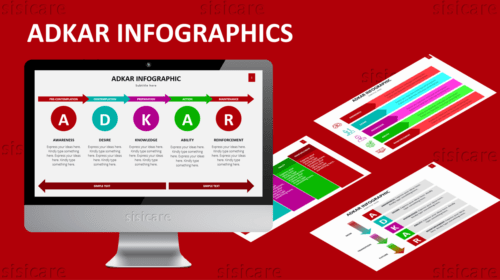
Fully editable in PowerPoint (shapes, icons, mockup, etc.)
4:3 and 16:9 screen layouts (FULL HD!)
Slide transition animation
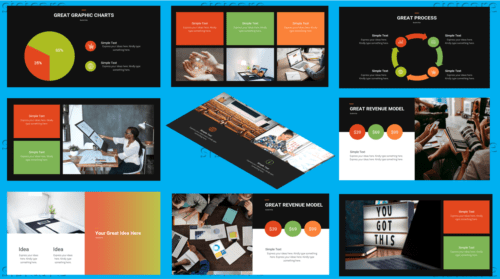
54 unique slides for each theme (+master slides)
Up to 2 pre-made themes (light & dark)
Devices mockup
Image placeholder
What`s inside the package
Colored-Light theme template with 4:3 and 16:9 screen layouts
Colored-Dark theme template with 4:3 and 16:9 screen layo
Reviews
There are no reviews yet.
Be the first to review “Sales Report Infographics” Cancel reply


Reviews
There are no reviews yet.