
Profit and Loss in Business Infographics
Original price was: $27.00.$2.70Current price is: $2.70.
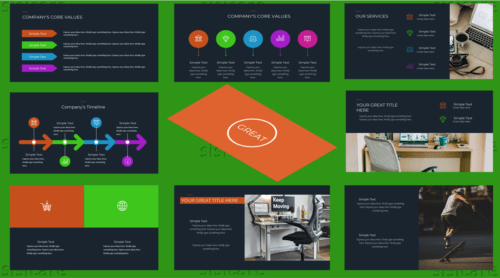
This infographic explains the process of how a business makes money. The graphic highlights the steps in the profit and loss cycle of a business.
Description
Every business needs this. Convince your investors effortlessly.
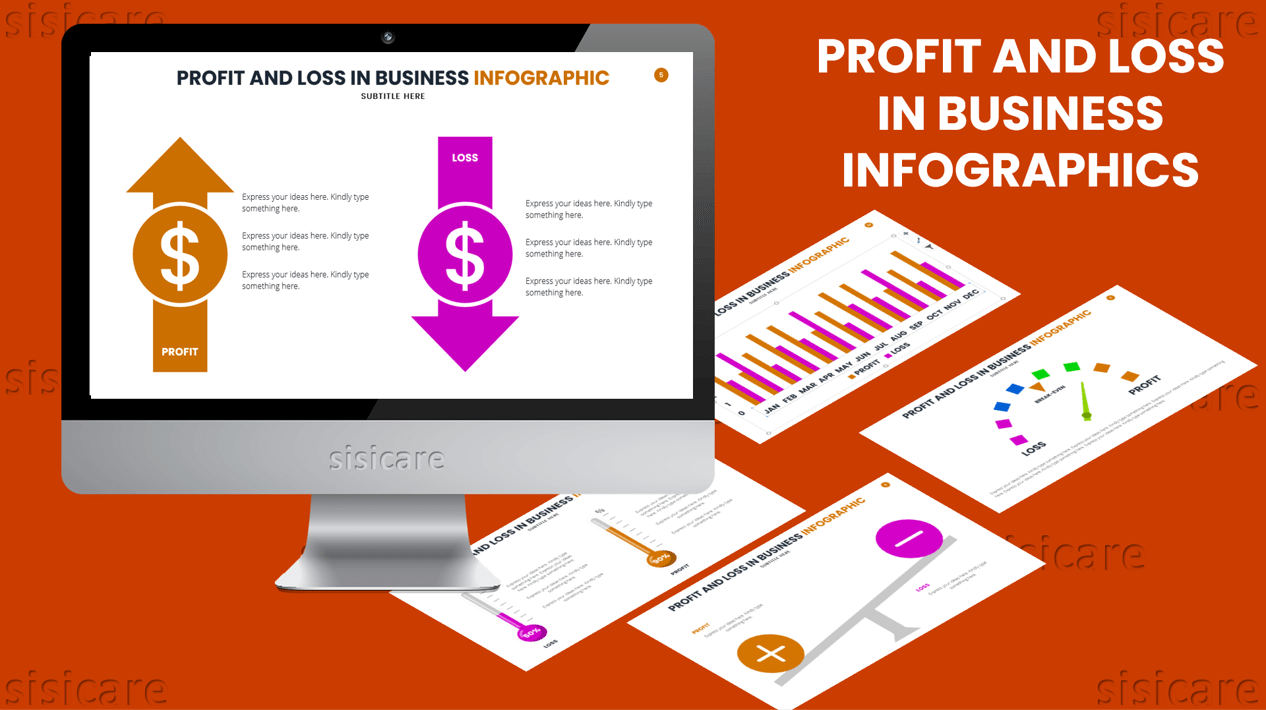
This infographic on “Profit and Loss in Business” is designed to help you convince investors. In fact, it shows you how a profit and loss statement can be used to effectively communicate your company’s financial situation. It explains the concept of how profits and losses affect the stock market. It also covers some of the most common methods of financial analysis. The infographics can be used for presentations and pitches, especially when you are pitching investors or explaining your company’s financial situation.
- Fully editable in PowerPoint (shapes, icons, mockup, etc.)
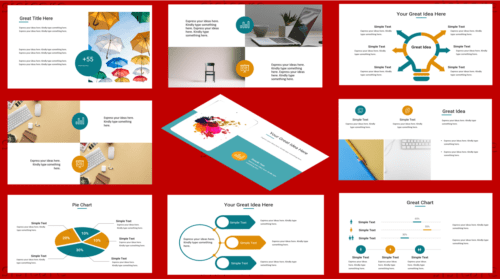
- 4:3 and 16:9 screen layouts (FULL HD!)
- Slide transition animation
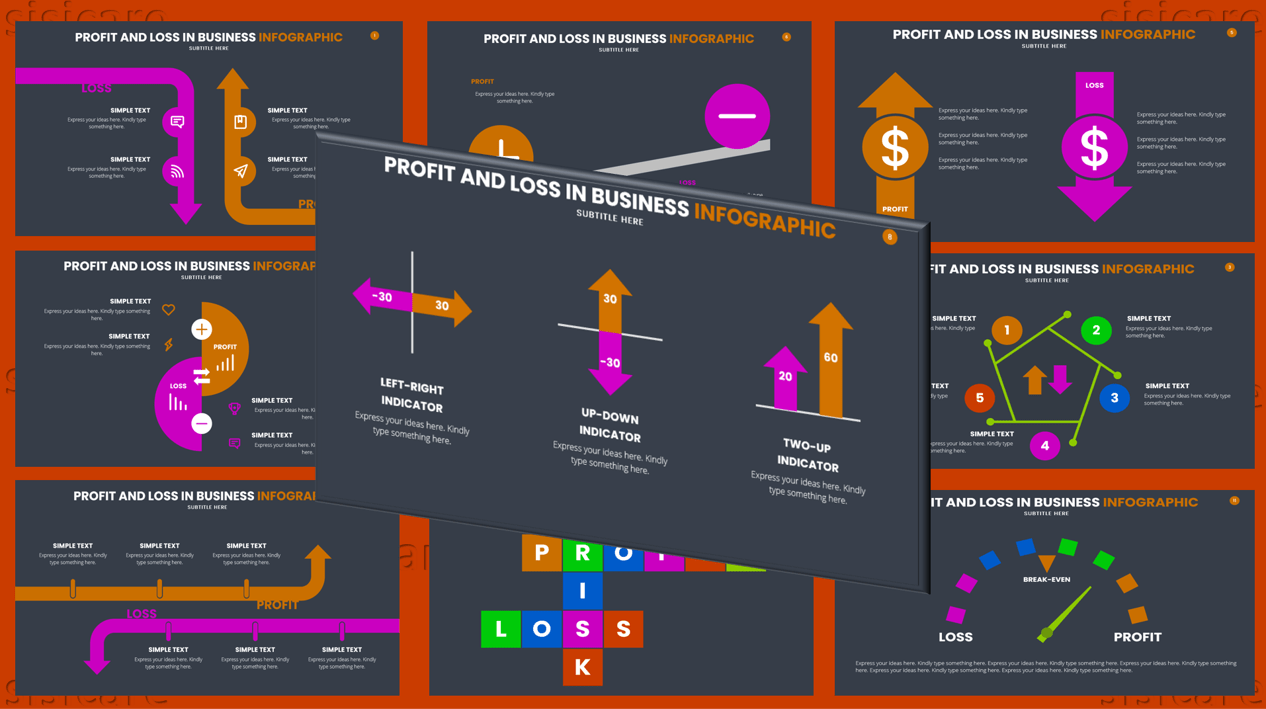
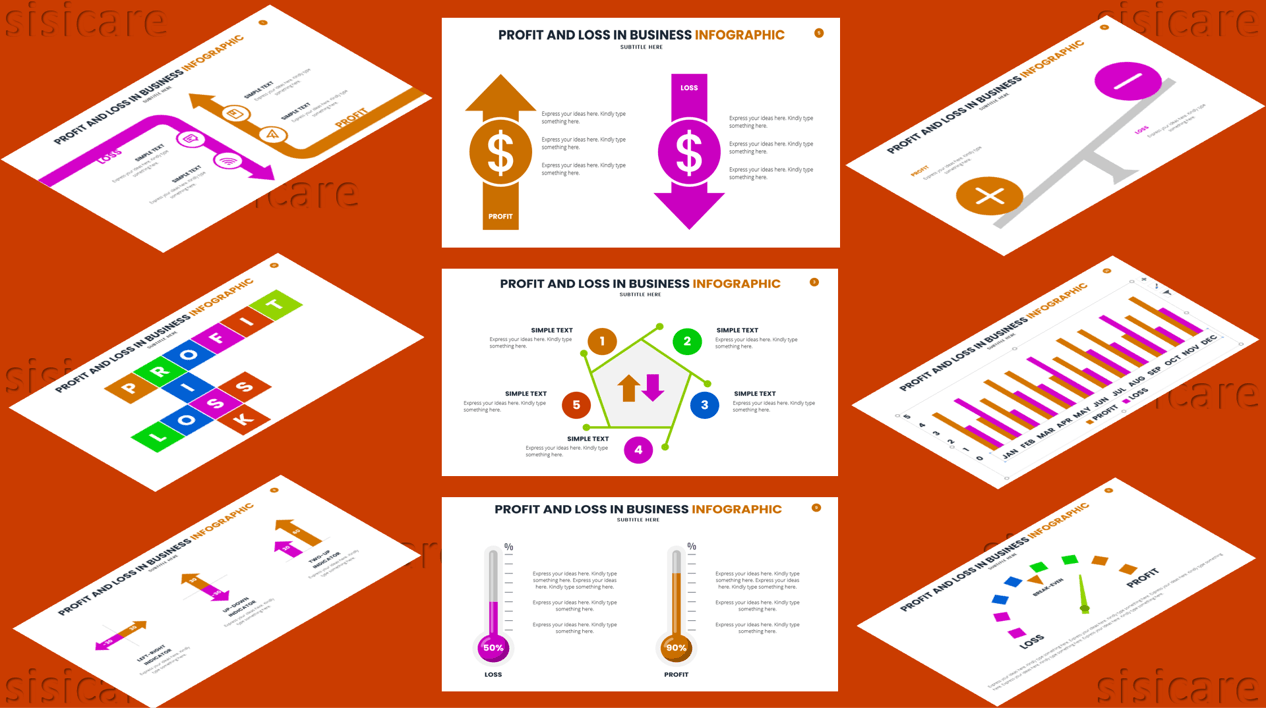
- 20 unique slides for both theme (+master slides)
- Up to 2 pre-made themes (light & dark)
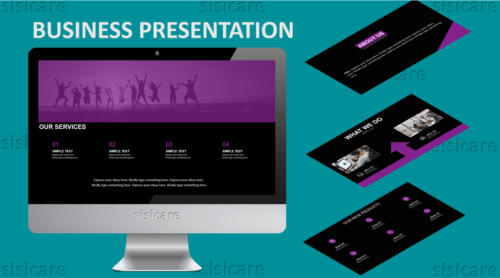
- Devices mockup
- Image placeholder
What`s inside the package
- Colored-Light theme template with 4:3 and 16:9 screen layouts
- Colored-Dark theme template with 4:3 and 16:9 screen layouts
Related products
-
- Sale!
- Business, Dark Theme, Light Theme, Presentations
Brown Theme Presentation
- Original price was: $27.00.$2.70Current price is: $2.70.
- Add to cart
-
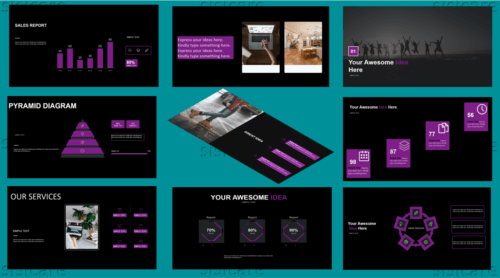
- Sale!
- Business, Dark Theme, Light Theme, Presentations
Dark Purple and Black Theme Presentation
- Original price was: $27.00.$2.70Current price is: $2.70.
- Add to cart
-
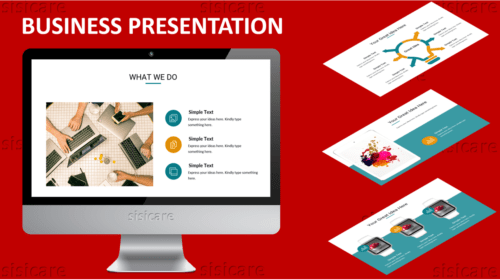
- Sale!
- Business, Dark Theme, Light Theme, Presentations
Gold and Teal Theme Presentation
- Original price was: $27.00.$2.70Current price is: $2.70.
- Add to cart

Reviews
There are no reviews yet.