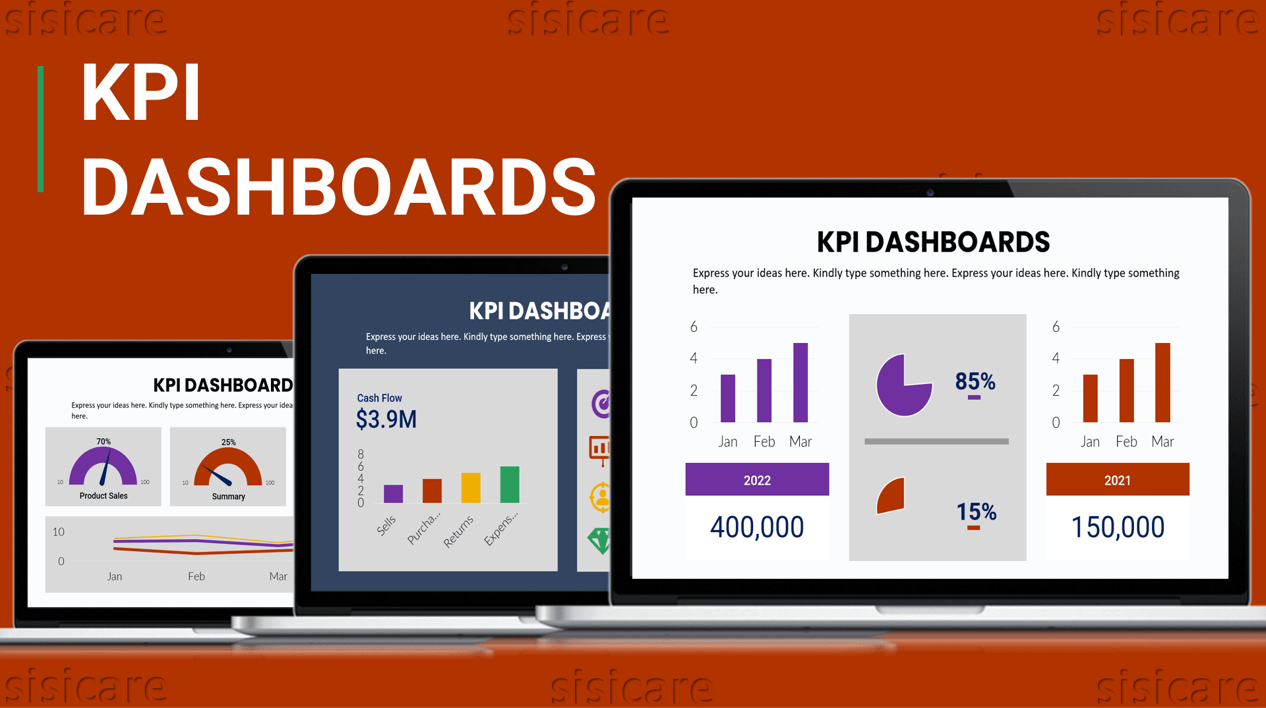
KPI Dashboards Slides
Original price was: $27.00.$2.70Current price is: $2.70.
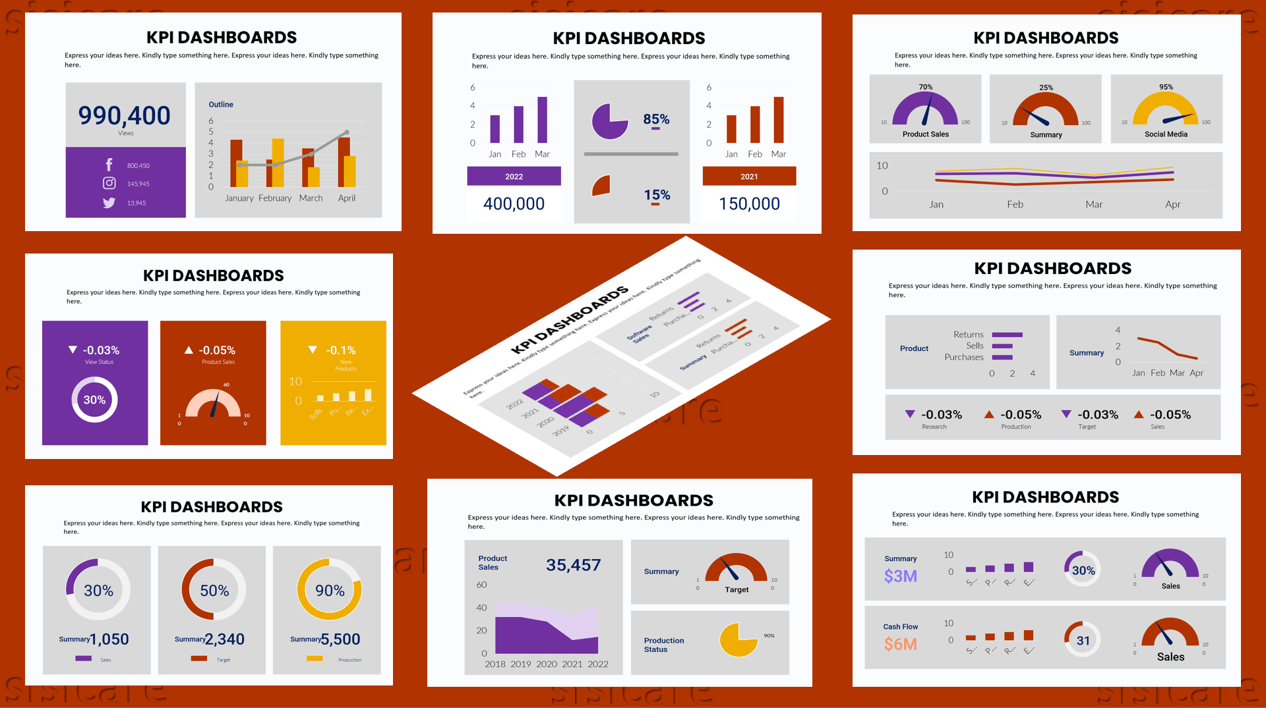
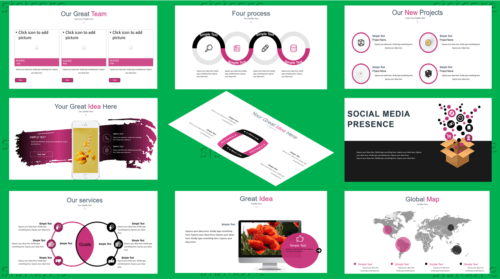
The KPI Dashboards Slide is a visualizer designed to help you track your goals. It can help you visualize your achievements by displaying them in a slide show, with the possibility of adding charts and graphs as well. This product is simple to use and it can help you make the most out of your goals.
Description
Visualize your achievements with graphs and charts
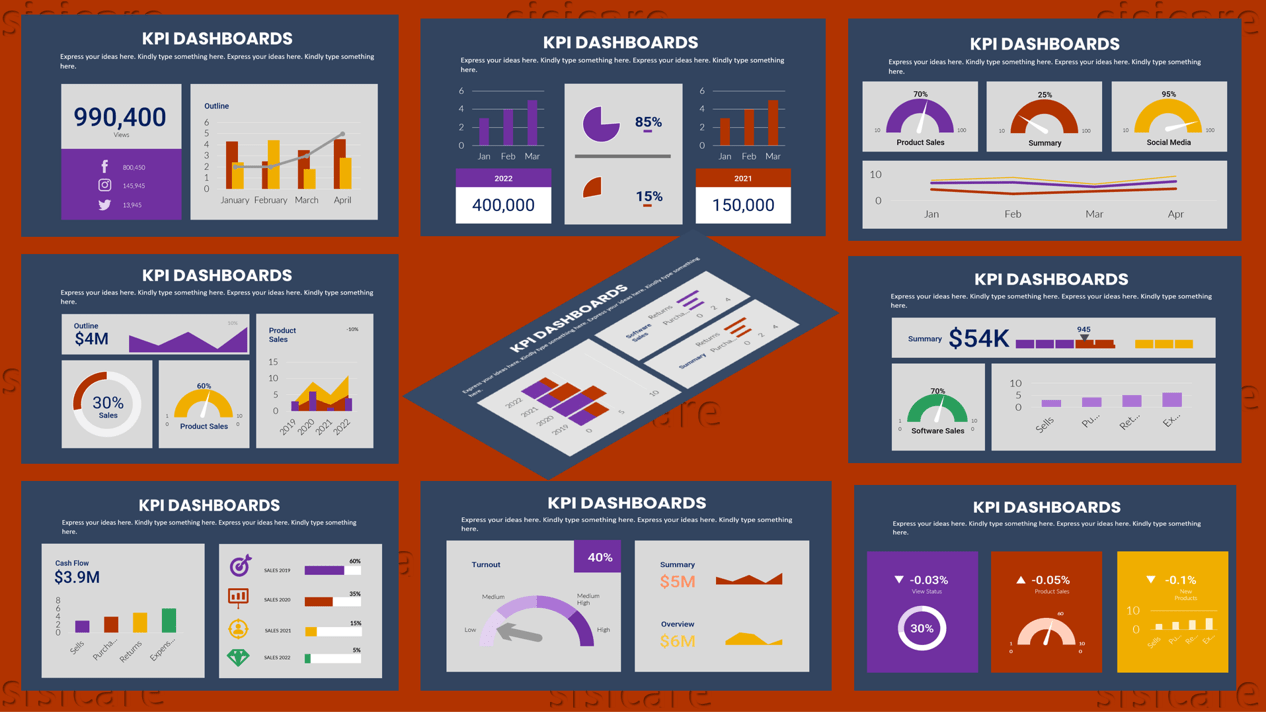
The KPI Dashboard Slides are designed to visualize your company’s key performance indicators. These slides feature graphs and charts that help you quickly see trends in your data and make quick adjustments. With the KPI Dashboard Slides you can track your metrics and measure the results of your business. This tool gives you complete control over your metrics and lets you focus on what matters.
Features
- Fully editable in PowerPoint (shapes, icons, mockup, etc.)
- 4:3 and 16:9 screen layouts (FULL HD!)
- Slide transition animation
- 24 unique slides for both theme (+master slides)
- Up to 2 pre-made themes (light & dark)
- Devices mockup
- Image placeholder
What`s inside the package
- Colored-Light theme template with 4:3 and 16:9 screen layouts
- Colored-Dark theme template with 4:3 and 16:9 screen layouts
Related products
-
- Sale!
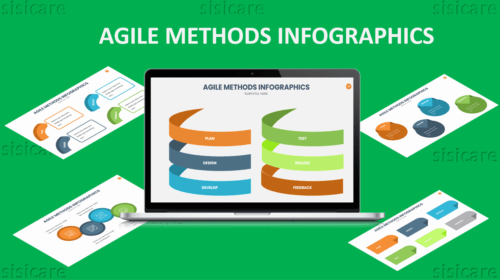
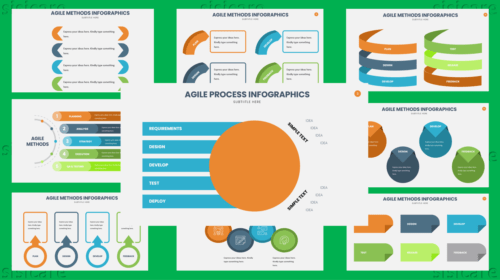
- Dark Theme, Infographics, Light Theme, Presentations
Agile Methods Infographic
- Original price was: $27.00.$2.70Current price is: $2.70.
- Add to cart
-
- Sale!
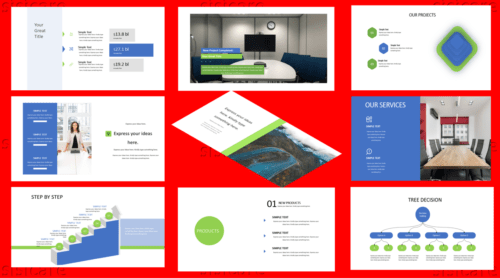
- Business, Dark Theme, Light Theme, Presentations
Green and Blue Theme
- Original price was: $27.00.$2.70Current price is: $2.70.
- Add to cart
-
- Sale!
- Business, Dark Theme, Light Theme, Presentations
Pink and Black Theme Presentation
- Original price was: $27.00.$2.70Current price is: $2.70.
- Add to cart


Reviews
There are no reviews yet.