$27.00Original price was: $27.00.$2.70Current price is: $2.70.
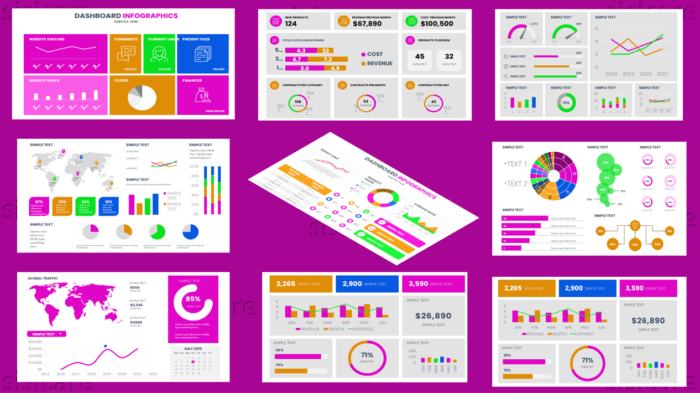
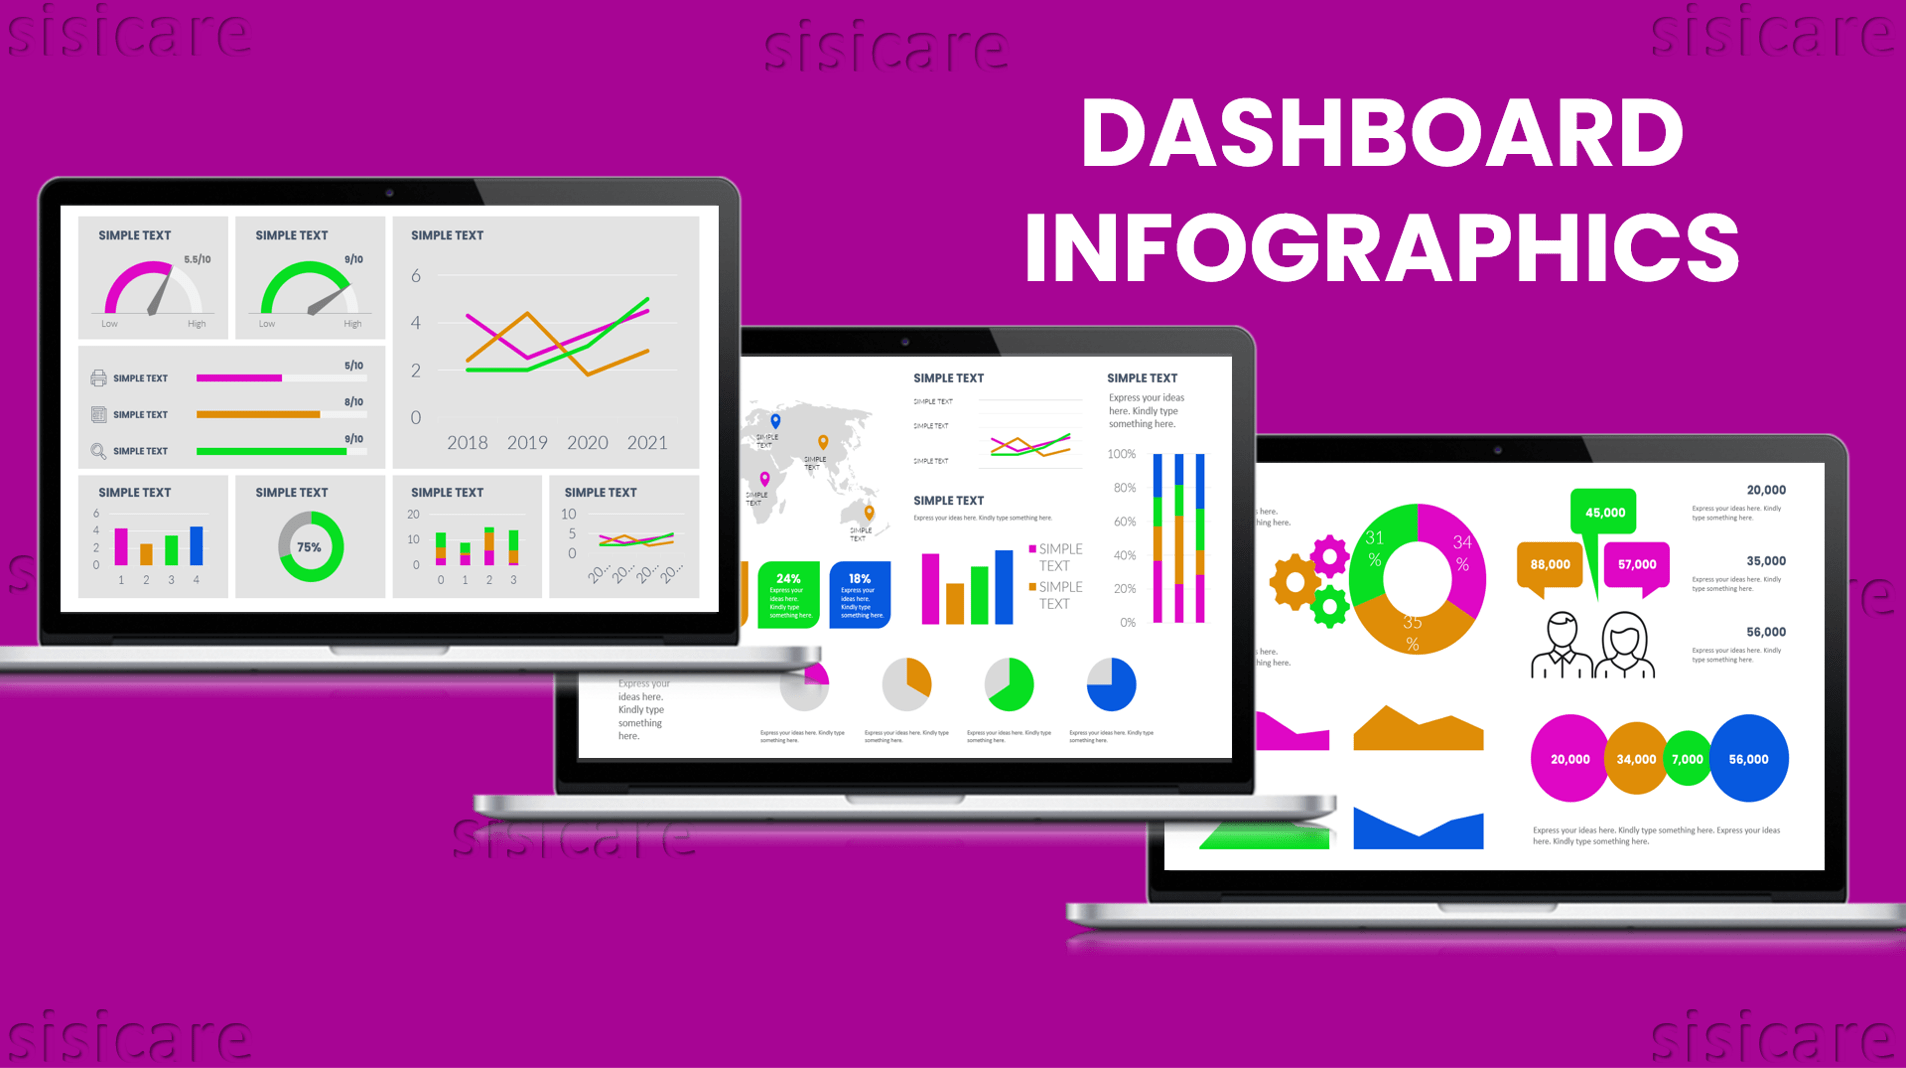
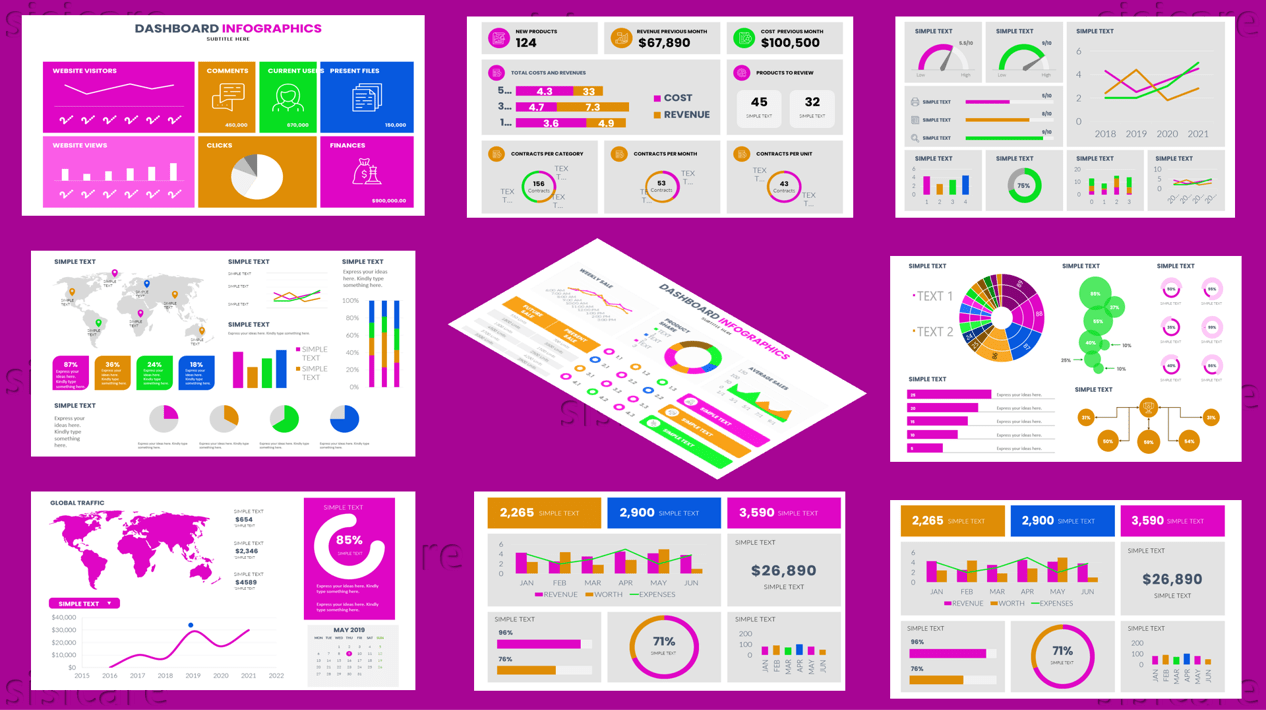
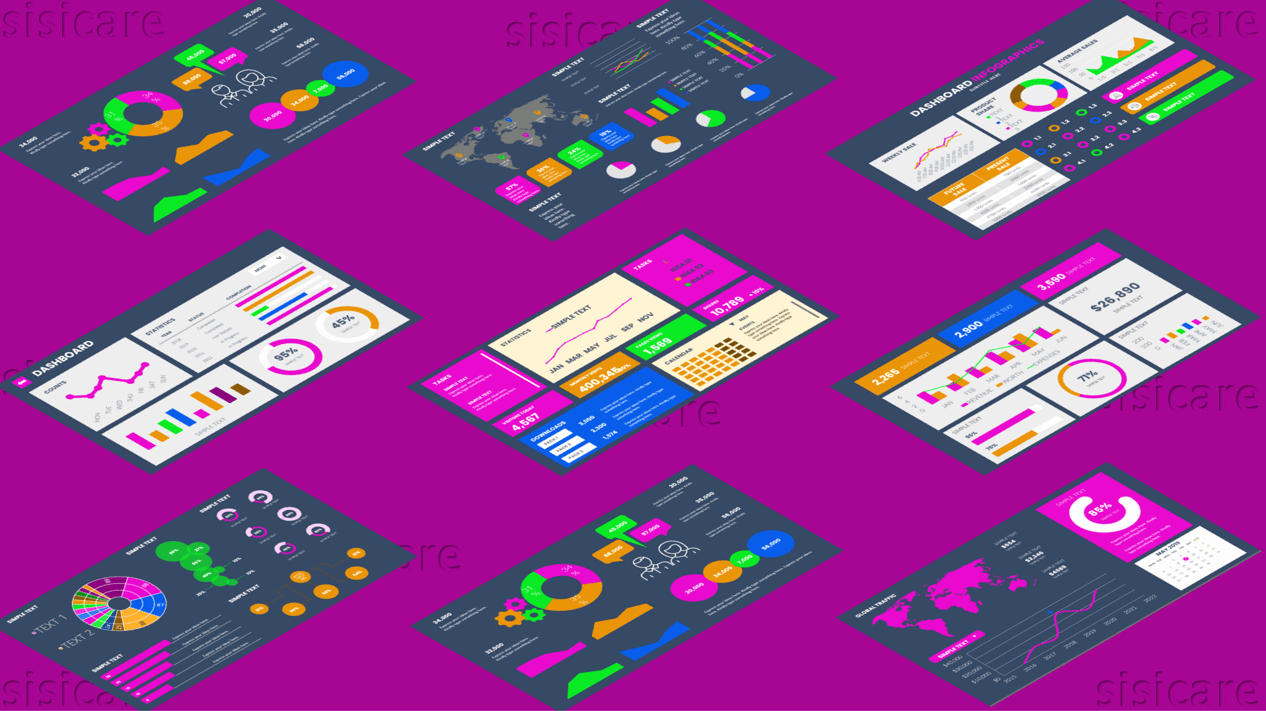
Dashboards are a vital part of any business, as they allow you to present data in a more visual way. They allow you to create unique designs that stand out and make your dashboard more effective.
Create unique dashboards with dynamic designs for the best data representation and ease of interpretation
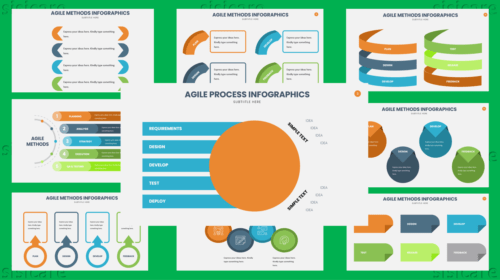
Graphs are a key component of any statistical analysis, whether you’re looking at the relationship between two variables or comparing the performance of multiple groups. Represent your statistical analysis with intuitive and dynamic graphs using Education Charts.
Ms Excel linked charts
Fully editable in PowerPoint (shapes, icons, mockup, etc.)
4:3 and 16:9 screen layouts (FULL HD!)
Slide transition animation
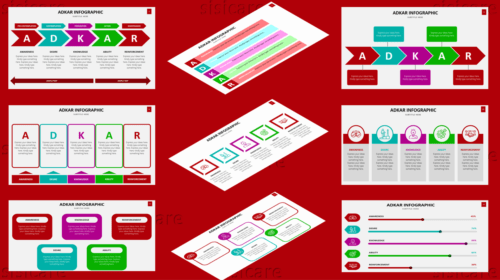
20 unique slides for both themes (+master slides)
Up to 2 pre-made themes (light & dark)
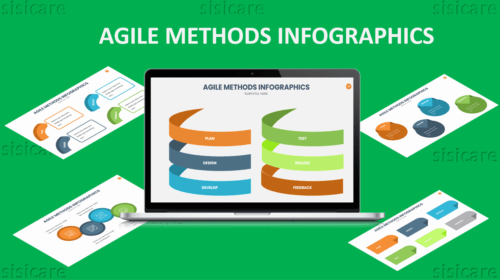
Devices mockup
Image placeholder
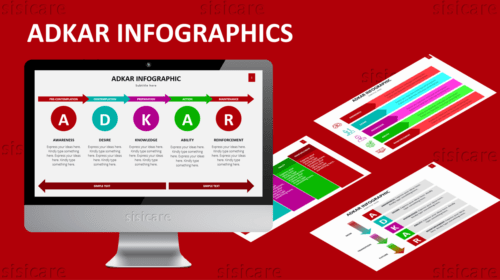
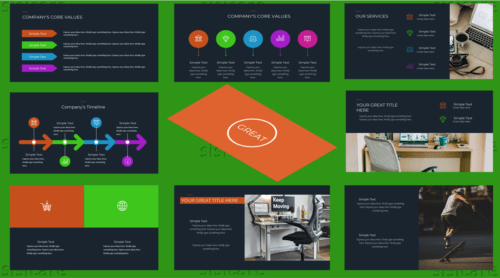
What`s inside the package
Colored-Light theme template with 4:3 and 16:9 screen layouts
Colored-Dark theme template with 4:3 and 16:9 screen layouts
Reviews
There are no reviews yet.
Be the first to review “Dashboard Infographics” Cancel reply


Reviews
There are no reviews yet.