$27.00Original price was: $27.00.$2.70Current price is: $2.70.
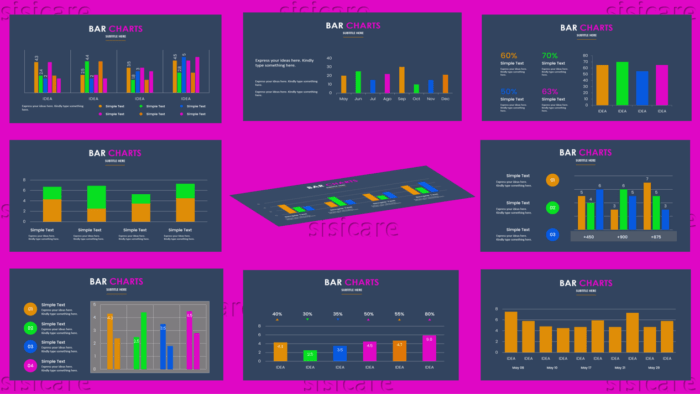
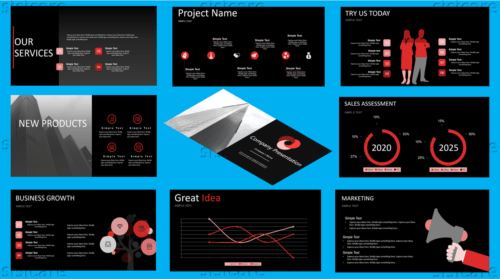
Bar charts are the best way to present data with a variety of visual effects. Use bar charts to tell a story, to make important points, or to just make a point.
Keep your audience engaged and hooked with stunning graphical analysis
Bar charts are a powerful way to engage your audience. With bar charts, you can display data in a clear and easy-to-read format. When displayed on a large screen, the graphic becomes an effective tool for demonstrating and communicating information. The audience can easily follow the line graph as it represents the overall trend of data. It is a good visual aid for representing numeric data.
Ms Excel linked charts
Fully editable in PowerPoint (shapes, icons, mockup, etc.)
4:3 and 16:9 screen layouts (FULL HD!)
Slide transition animation
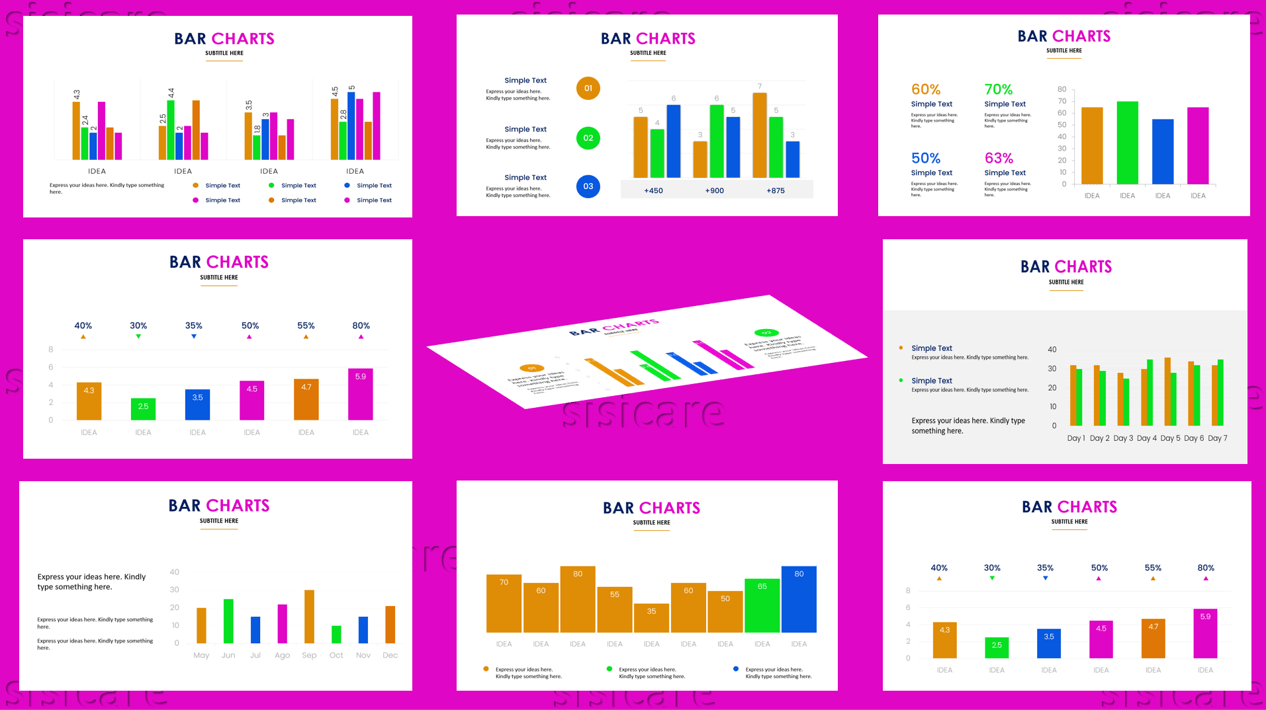
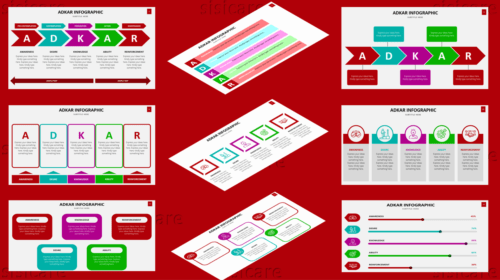
20 unique slides for both themes (+master slides)
Up to 2 pre-made themes (light & dark)
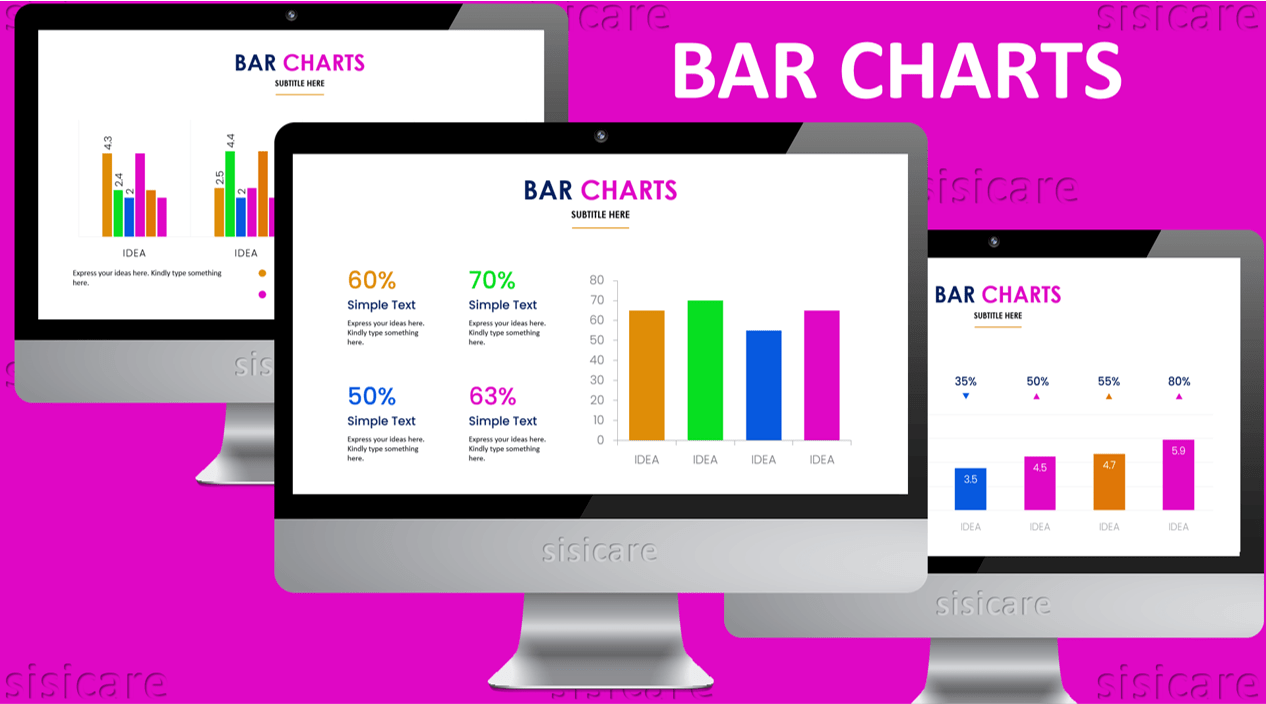
Devices mockup
Image placeholder
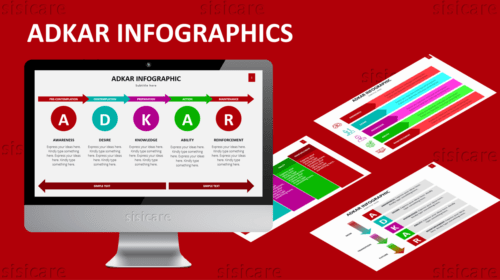
What`s inside the package
Colored-Light theme template with 4:3 and 16:9 screen layouts
Colored-Dark theme template with 4:3 and 16:9 screen layouts


Reviews
There are no reviews yet.